How many people rely on electricity-powered medical devices?
3,352,867 Medicare beneficiaries (4.8%) rely on electricity-dependent medical equipment at home, according to HHS emPOWER data. California has the most, and Florida has the most device users exposed to outage hours each year. Below are every state's figures, the overlap with outages and how long a battery runs common devices.
Key findings
3,352,867 Medicare beneficiaries rely on electricity-dependent medical equipment at home, such as ventilators, oxygen concentrators, home dialysis and powered wheelchairs. That is 4.8% of 70,162,721 beneficiaries (HHS emPOWER).
The most live in California (293,069), Texas (234,641) and Florida (217,622).
Relative to its Medicare population, Wyoming has the highest rate: 126 per 1,000 beneficiaries, against 48 nationally.
The four highest rates are all Mountain West states: Wyoming (126), Colorado (116), New Mexico (106) and Utah (100) per 1,000. HHS doesn't publish a device breakdown, so the data can't show why.
Multiplying device users by each state's average outage time (2015–2025) puts Florida first for device-user hours without power a year, ahead of Texas and California.
A 350 W home oxygen concentrator runs about 2.4 hours on a 1,000 Wh power station, and a CPAP with heated humidifier (56 W typical) about 15 hours.
How many people depend on electricity-powered medical devices?
3,352,867 Medicare beneficiaries in the United States rely on electricity-dependent medical equipment at home, according to the U.S. Department of Health and Human Services' emPOWER program (data published October 2026). That is 4.8% of the 70,162,721 people in Medicare. The count covers ventilators, BiPAP machines, oxygen concentrators, home dialysis, enteral feeding and IV pumps, suction pumps, electric wheelchairs and scooters, electric beds and implanted heart pumps. People outside Medicare aren't included, so the true number of Americans who depend on powered equipment is higher.
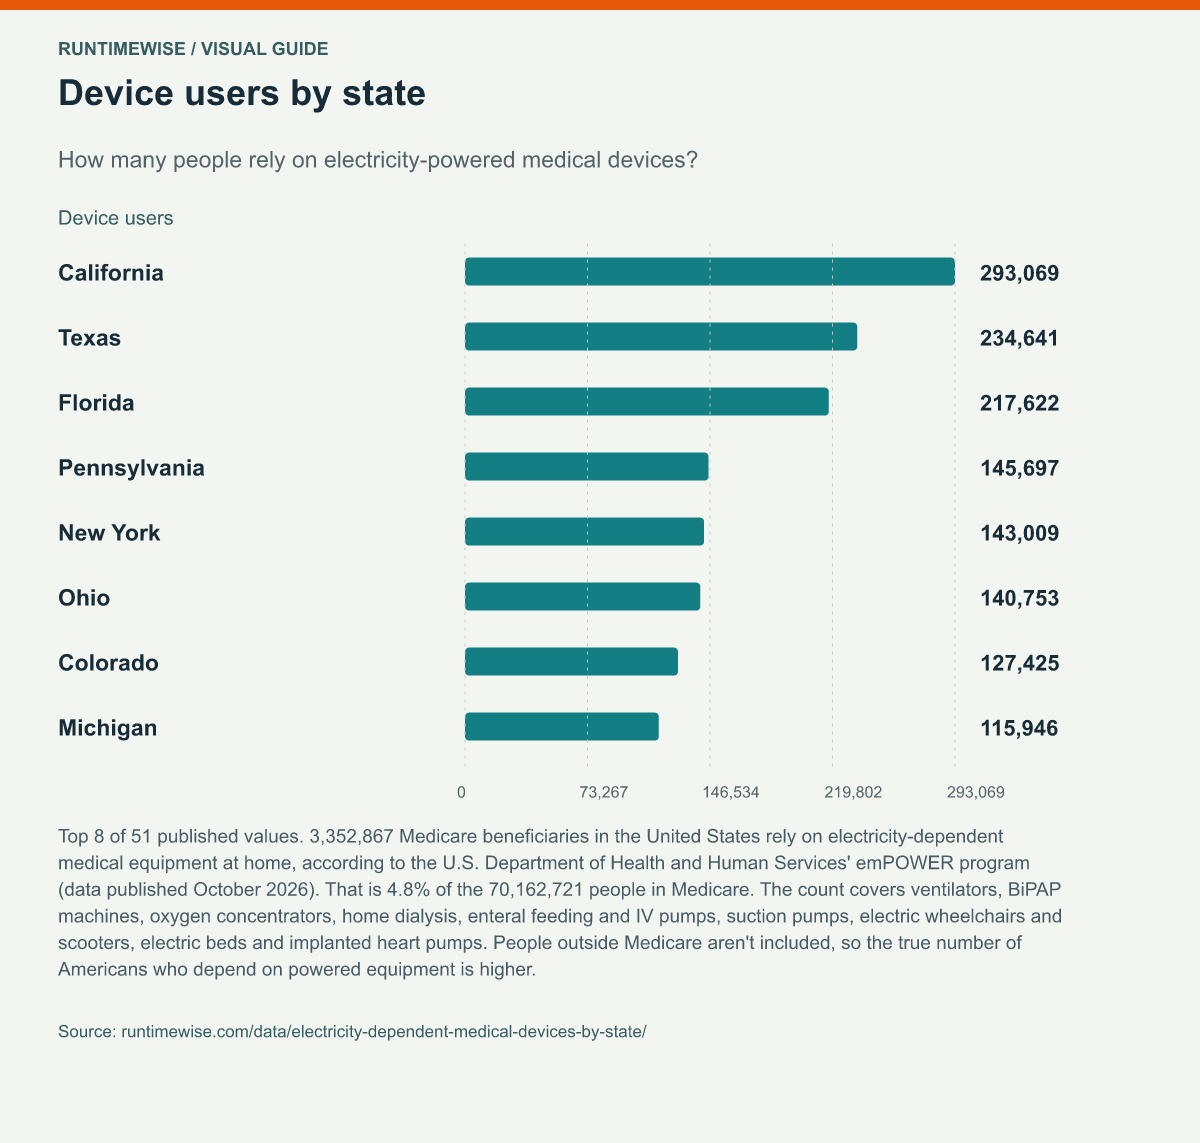
| State | Device users | Medicare total | Per 1,000 | Outage hours 2025 | Average outage hours 2015–2025 | Device-user outage hours (millions) |
|---|---|---|---|---|---|---|
| California | 293,069 | 7,267,978 | 40 | 6.0 | 4.7 | 1.38 |
| Texas | 234,641 | 5,021,813 | 47 | 3.5 | 9.0 | 2.11 |
| Florida | 217,622 | 5,352,501 | 41 | 1.2 | 10.0 | 2.17 |
| Pennsylvania | 145,697 | 3,041,555 | 48 | 6.9 | 4.7 | 0.69 |
| New York | 143,009 | 4,062,461 | 35 | 4.1 | 5.1 | 0.73 |
| Ohio | 140,753 | 2,635,208 | 53 | 3.4 | 4.8 | 0.67 |
| Colorado | 127,425 | 1,093,785 | 116 | 4.5 | 2.7 | 0.34 |
| Michigan | 115,946 | 2,328,700 | 50 | 10.1 | 9.9 | 1.14 |
| North Carolina | 109,022 | 2,331,851 | 47 | 3.2 | 10.1 | 1.10 |
| Georgia | 106,262 | 2,037,100 | 52 | 4.5 | 7.2 | 0.77 |
| Illinois | 105,300 | 2,490,268 | 42 | 2.4 | 2.7 | 0.28 |
| Tennessee | 94,553 | 1,531,905 | 62 | 3.8 | 6.6 | 0.63 |
| Virginia | 86,372 | 1,761,612 | 49 | 12.7 | 10.2 | 0.88 |
| Indiana | 80,139 | 1,429,503 | 56 | 6.3 | 5.1 | 0.40 |
| Kentucky | 77,843 | 1,011,168 | 77 | 6.6 | 6.6 | 0.52 |
| Missouri | 73,572 | 1,373,931 | 54 | 7.8 | 4.1 | 0.30 |
| Arizona | 72,215 | 1,557,587 | 46 | 1.1 | 1.6 | 0.11 |
| New Jersey | 63,362 | 1,848,497 | 34 | 2.6 | 4.3 | 0.27 |
| Alabama | 60,639 | 1,144,040 | 53 | 4.5 | 9.0 | 0.54 |
| South Carolina | 58,462 | 1,279,483 | 46 | 2.5 | 11.2 | 0.65 |
| Washington | 58,177 | 1,587,375 | 37 | 6.4 | 6.3 | 0.37 |
| Louisiana | 50,406 | 968,592 | 52 | 4.5 | 21.5 | 1.08 |
| New Mexico | 50,292 | 475,731 | 106 | 2.7 | 2.7 | 0.13 |
| Wisconsin | 49,878 | 1,378,315 | 36 | 4.4 | 3.8 | 0.19 |
| Oklahoma | 48,938 | 830,891 | 59 | 5.0 | 6.4 | 0.31 |
| Utah | 48,609 | 485,541 | 100 | 1.9 | 3.0 | 0.15 |
| Arkansas | 48,538 | 687,142 | 71 | 7.9 | 8.1 | 0.39 |
| Massachusetts | 45,895 | 1,520,183 | 30 | 2.0 | 4.4 | 0.20 |
| Minnesota | 45,238 | 1,209,760 | 37 | 3.0 | 2.9 | 0.13 |
| Maryland | 43,708 | 1,203,325 | 36 | 3.0 | 2.7 | 0.12 |
| Mississippi | 43,011 | 658,026 | 65 | 8.7 | 10.9 | 0.47 |
| Oregon | 41,578 | 962,524 | 43 | 5.0 | 6.6 | 0.27 |
| Nevada | 37,969 | 632,298 | 60 | 2.1 | 2.0 | 0.08 |
| West Virginia | 36,883 | 456,771 | 81 | 16.9 | 14.2 | 0.53 |
| Kansas | 31,754 | 610,619 | 52 | 3.2 | 4.1 | 0.13 |
| Iowa | 30,168 | 710,754 | 42 | 3.1 | 3.6 | 0.11 |
| Idaho | 28,362 | 418,690 | 68 | 4.9 | 3.8 | 0.11 |
| Connecticut | 24,633 | 787,749 | 31 | 3.1 | 8.5 | 0.21 |
| Nebraska | 20,297 | 399,677 | 51 | 9.0 | 4.0 | 0.08 |
| Montana | 18,400 | 273,436 | 67 | 4.8 | 3.7 | 0.07 |
| Wyoming | 16,869 | 133,480 | 126 | 3.7 | 3.0 | 0.05 |
| Maine | 13,783 | 391,519 | 35 | 6.1 | 17.9 | 0.25 |
| New Hampshire | 11,030 | 362,421 | 30 | 2.5 | 6.7 | 0.07 |
| Delaware | 10,847 | 259,823 | 42 | 1.7 | 2.2 | 0.02 |
| South Dakota | 10,388 | 207,411 | 50 | 4.7 | 2.9 | 0.03 |
| Hawaii | 9,184 | 316,855 | 29 | 5.6 | 3.7 | 0.03 |
| Rhode Island | 6,751 | 253,551 | 27 | 3.0 | 5.4 | 0.04 |
| North Dakota | 6,174 | 154,490 | 40 | 3.5 | 3.2 | 0.02 |
| Vermont | 5,844 | 170,872 | 34 | 4.2 | 9.7 | 0.06 |
| Alaska | 3,756 | 124,437 | 30 | 9.4 | 7.1 | 0.03 |
| Washington, D.C. | 3,677 | 97,658 | 38 | 0.8 | 1.1 | 0.00 |
Device users = HHS emPOWER electricity-dependent beneficiaries. Outage hours = EIA SAIDI ÷ 60. The last column multiplies device users by average outage hours.
Which states put the most device users at risk from outages?
Outage risk depends both on how many people rely on power and on how often the power fails. Multiplying each state's device users by its average yearly hours without power gives a rough measure of exposure. Florida leads with about 2.2 million device-user hours a year, followed by Texas (2.1 million) and California (1.4 million). The measure assumes device users have the same outages as the average customer in their state, which is a simplification.
How long can a battery run a home medical device?
A home oxygen concentrator is the hardest common device to back up. At about 350 W, it drains a 1,000 Wh power station in roughly 2.4 hours. CPAP machines use far less, especially with the heated humidifier off. These runtimes are calculated from the manufacturers' published power figures, not tested. Anyone who depends on a device should follow their doctor's and supplier's backup plan.
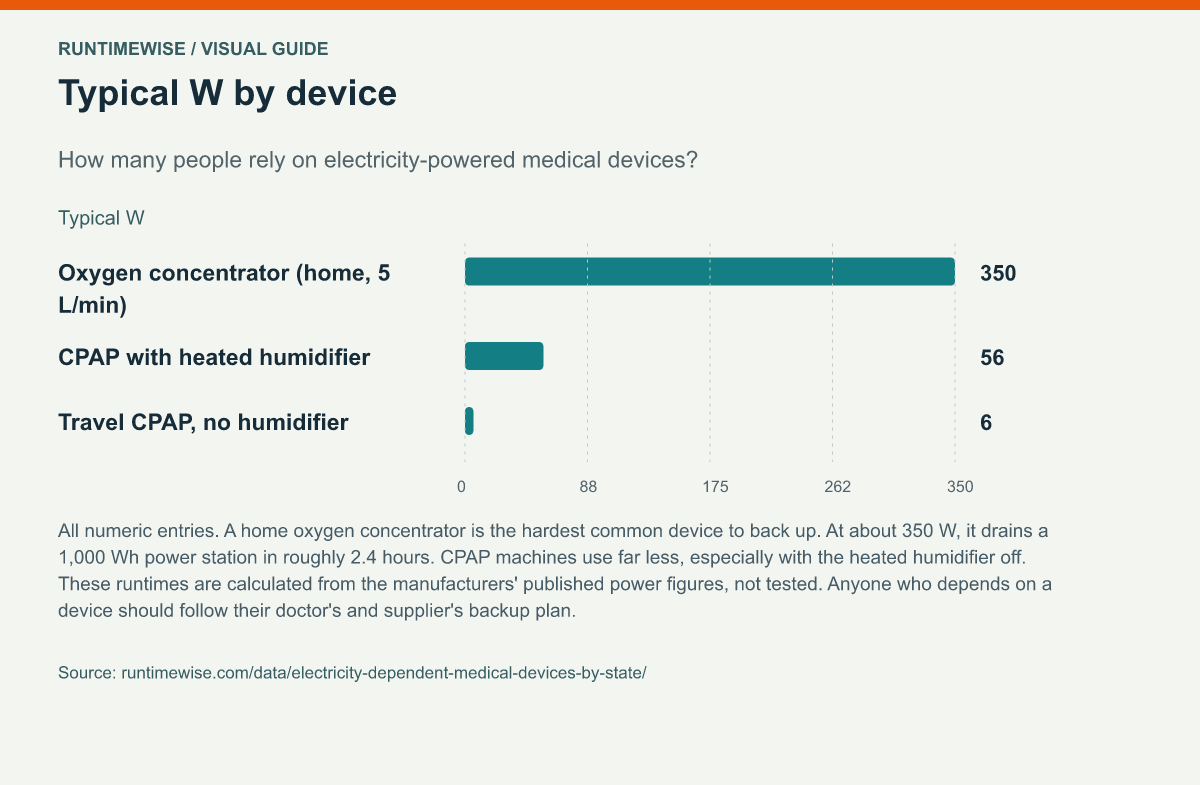
| Device | Typical W | 500 Wh | 1,000 Wh | 2,000 Wh | Stations that run it |
|---|---|---|---|---|---|
| Oxygen concentrator (home, 5 L/min) | 350 | 1.2 h | 2.4 h | 4.9 h | 54 of 59 |
| CPAP with heated humidifier | 56 | 7.6 h | 15 h | 30 h | 59 of 59 |
| Travel CPAP, no humidifier | 6 | 2.8 days | 5.6 days | 11.2 days | 59 of 59 |
What should electricity-dependent households do before an outage?
HHS, FEMA and utilities advise people who rely on powered medical equipment to register with their utility's medical baseline or priority restoration program. They should also keep a written plan with their device supplier and have backup power sized for the device's draw and the likely length of an outage. A battery power station is safe to use indoors, unlike a fuel generator. Our generator carbon monoxide data shows why that matters.
Can you download and reuse this data?
Yes. The main table is available as a CSV file (51 rows), and every chart on this page opens as a full-size image when you select it. Our compilation, calculations and charts are licensed CC BY 4.0: reuse them in articles, reports, slides or lessons, as long as you credit RuntimeWise and link to this page. The underlying data belongs to the sources listed below, so please credit them too.
How should you cite this page?
Copy one of these. A link to this page is the only credit we ask for.
Citation
RuntimeWise (2026). Electricity-Dependent Medical Device Users by State. Retrieved October 22, 2026, from https://www.runtimewise.com/data/electricity-dependent-medical-devices-by-state/HTML link
<a href="https://www.runtimewise.com/data/electricity-dependent-medical-devices-by-state/">Electricity-Dependent Medical Device Users by State</a> (RuntimeWise)How was this data compiled?
Device-user counts come from the public, de-identified data of the HHS emPOWER program (state layer of its public map service), retrieved 2026-10-22. HHS refreshes the data monthly but doesn't state which claims month each refresh covers. Medicare totals include Fee-for-Service and Medicare Advantage. Outage hours come from EIA Electric Power Annual Table 11.4; see our outage data.
- emPOWER counts beneficiaries with Medicare claims for the listed devices in the past 13 months, or 36 months for oxygen concentrators and 5 years for implanted cardiac devices. Counts from 1 to 10 are shown as 11 for privacy.
- The rate per 1,000 and the device-user outage hours are our calculations. The public data has no breakdown by device type.
- Limits: people covered only by Medicaid, private insurance or no insurance aren't counted. A claim shows a device was supplied, not that it is used every day. A state-wide outage average doesn't give any individual's risk.