Power outage statistics by state (2025)
In 2025 the average U.S. electricity customer was without power for 4.5 hours across 1.34 interruptions, according to EIA data. West Virginia had the most outage time (16.9 hours per customer) and Washington, D.C. the least (0.8 hours). Below are every state's figures for 2015–2025, the long-run leaders, the share caused by storms and the trend.
Key findings
The average U.S. electricity customer went without power for 4.5 hours in 2025, across 1.34 interruptions. That is down from 11.0 hours in 2024, the highest year in the 2015–2025 series.
Leaving out major storm days, outages took 2.1 hours in 2025. Major events caused 53% of all outage time in 2025 and 80% in 2024.
West Virginia had the most outage time in 2025: 16.9 hours per customer, ahead of Virginia (12.7 hours) and Michigan (10.1 hours).
Over 11 years (2015–2025), Louisiana averaged the most outage time, 21.5 hours a year. Washington, D.C. averaged the least, 1.1 hours.
12 states averaged at least 50% more outage time in 2021–2025 than in 2015–2019, while 9 cut theirs by 20% or more.
How many hours without power did the average American have in 2025?
The average U.S. electricity customer was without power for 4.5 hours (269 minutes) in 2025, according to reliability data the U.S. Energy Information Administration collects from utilities using the IEEE 1366 method. That is 41% of the 2024 figure. In 2024, hurricanes Beryl, Helene and Milton pushed the average to 11.0 hours, the highest in the series.
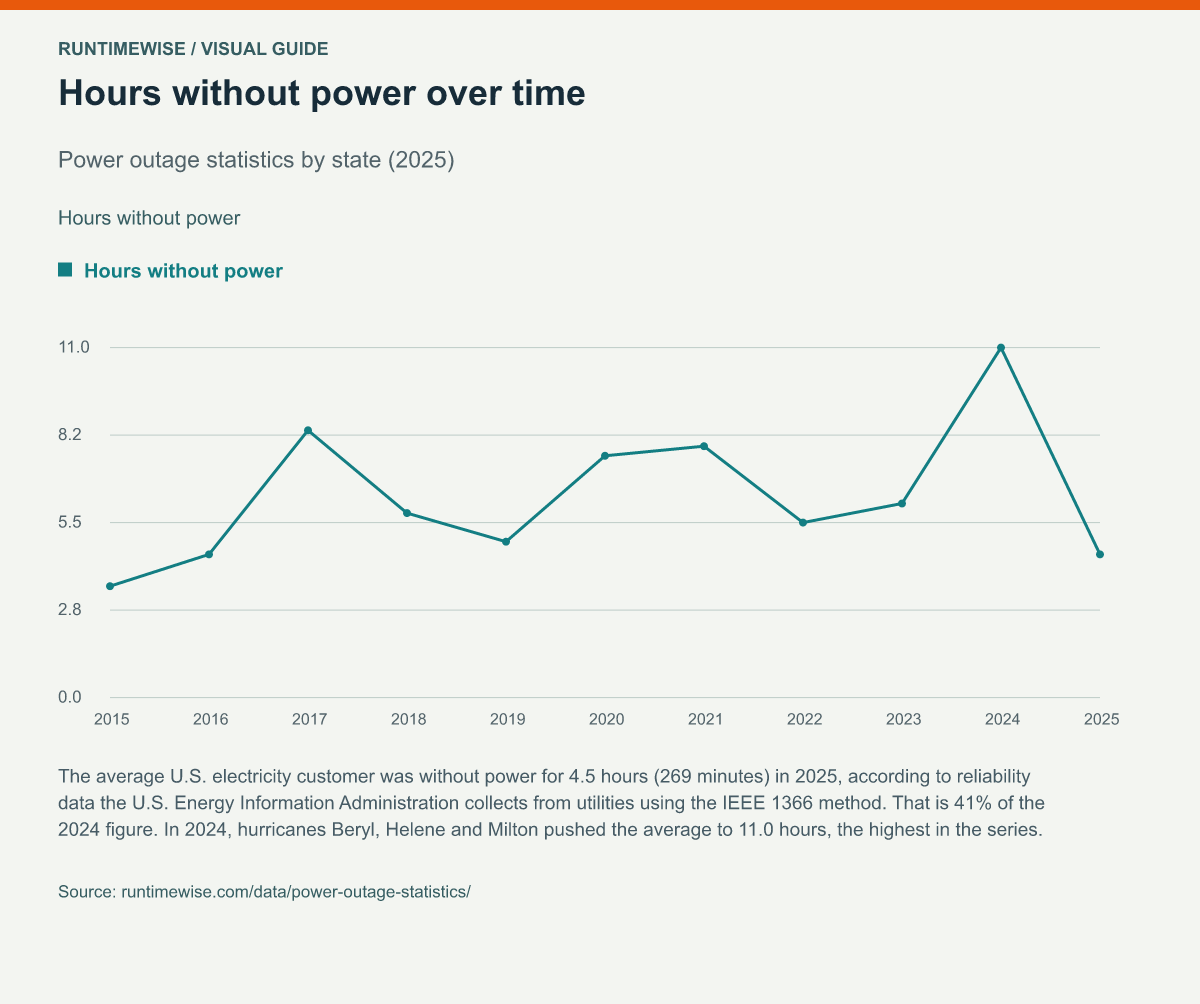
| Year | Hours without power | Interruptions | Minutes per outage | Hours excl. major events | Share from major events |
|---|---|---|---|---|---|
| 2025 | 4.5 | 1.34 | 201 | 2.1 | 53% |
| 2024 | 11.0 | 1.53 | 433 | 2.2 | 80% |
| 2023 | 6.1 | 1.35 | 272 | 2.1 | 66% |
| 2022 | 5.5 | 1.43 | 234 | 2.2 | 61% |
| 2021 | 7.9 | 1.44 | 331 | 2.1 | 74% |
| 2020 | 7.6 | 1.39 | 329 | 1.9 | 75% |
| 2019 | 4.9 | 1.33 | 222 | 2.0 | 59% |
| 2018 | 5.8 | 1.34 | 260 | 2.0 | 65% |
| 2017 | 8.4 | 1.42 | 356 | 1.9 | 77% |
| 2016 | 4.5 | 1.33 | 202 | 2.0 | 55% |
| 2015 | 3.5 | 1.27 | 164 | 1.9 | 44% |
The column that excludes major events measures the grid's everyday reliability, and it has stayed close to two hours a year for the whole period. The total swings because of storms, wildfires and ice. That is why the national figure jumps from year to year while the baseline barely moves.
Which states have the most power outages?
West Virginia customers spent the most time without power in 2025, 16.9 hours each on average. Virginia (12.7 hours), Michigan (10.1 hours), Alaska (9.4 hours) and Nebraska (9.0 hours) followed. Customers in Washington, D.C. (0.8 hours) and Arizona (1.1 hours) had the least. The table covers every state and the District of Columbia; select a column heading to sort it.
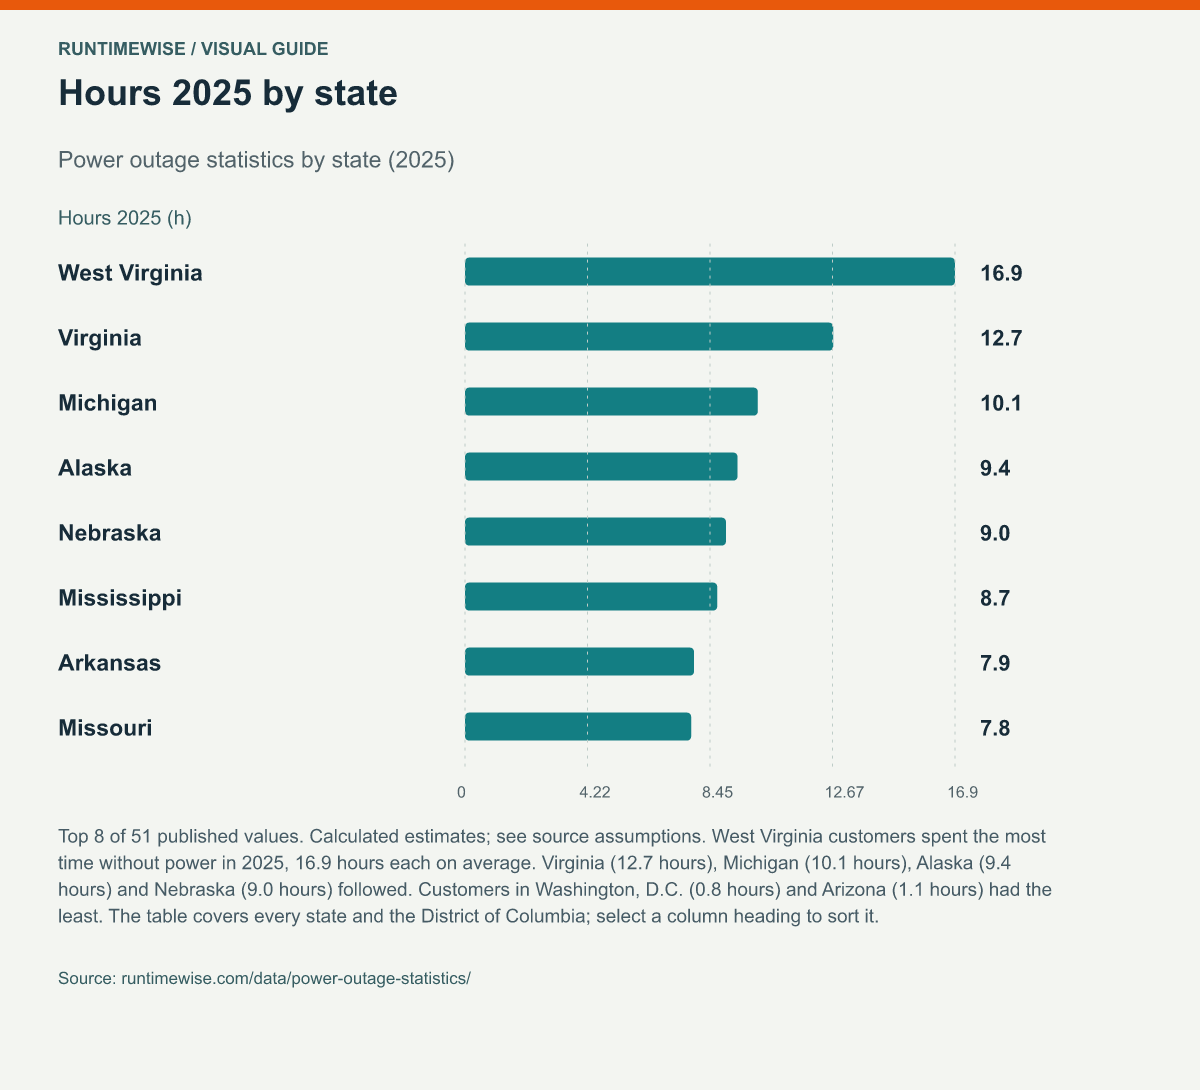
| State | Hours 2025 | Outages 2025 | Hours per outage | Hours excl. major events 2025 | Hours 2024 | Average 2015–2025 | Worst year (hours) |
|---|---|---|---|---|---|---|---|
| West Virginia | 16.9 | 3.08 | 5.5 | 8.3 | 19.4 | 14.2 | 19.4 (2024) |
| Virginia | 12.7 | 2.35 | 5.4 | 4.2 | 16.0 | 10.2 | 18.9 (2018) |
| Michigan | 10.1 | 1.42 | 7.2 | 2.7 | 8.0 | 9.9 | 18.8 (2023) |
| Alaska | 9.4 | 3.02 | 3.1 | 4.0 | 5.4 | 7.1 | 14.9 (2022) |
| Nebraska | 9.0 | 1.32 | 6.8 | 1.4 | 11.6 | 4.0 | 11.6 (2024) |
| Mississippi | 8.7 | 2.50 | 3.5 | 5.3 | 10.1 | 10.9 | 26.9 (2020) |
| Arkansas | 7.9 | 2.17 | 3.6 | 3.5 | 8.8 | 8.1 | 15.3 (2023) |
| Missouri | 7.8 | 1.37 | 5.7 | 1.9 | 3.5 | 4.1 | 7.8 (2025) |
| Pennsylvania | 6.9 | 1.42 | 4.8 | 2.3 | 5.9 | 4.7 | 9.4 (2018) |
| Kentucky | 6.6 | 1.86 | 3.5 | 2.9 | 9.0 | 6.6 | 14.4 (2023) |
| Washington | 6.4 | 1.45 | 4.4 | 2.4 | 10.7 | 6.3 | 10.7 (2024) |
| Indiana | 6.3 | 1.39 | 4.5 | 2.0 | 5.2 | 5.1 | 7.8 (2023) |
| Maine | 6.1 | 2.24 | 2.7 | 3.2 | 29.1 | 17.9 | 41.5 (2017) |
| California | 6.0 | 1.30 | 4.6 | 2.3 | 4.8 | 4.7 | 10.2 (2019) |
| Hawaii | 5.6 | 3.45 | 1.6 | 3.4 | 6.4 | 3.7 | 6.4 (2024) |
| Oregon | 5.0 | 1.12 | 4.5 | 1.7 | 9.7 | 6.6 | 26.5 (2021) |
| Oklahoma | 5.0 | 1.72 | 2.9 | 2.1 | 3.7 | 6.4 | 22.3 (2023) |
| Idaho | 4.9 | 1.16 | 4.2 | 2.4 | 3.4 | 3.8 | 7.3 (2021) |
| Montana | 4.8 | 1.33 | 3.6 | 2.3 | 5.7 | 3.7 | 5.7 (2024) |
| South Dakota | 4.7 | 1.33 | 3.5 | 1.1 | 1.4 | 2.9 | 5.6 (2022) |
| Colorado | 4.5 | 1.29 | 3.5 | 2.0 | 4.3 | 2.7 | 4.5 (2025) |
| Louisiana | 4.5 | 2.21 | 2.1 | 3.8 | 10.5 | 21.5 | 97.8 (2021) |
| Alabama | 4.5 | 1.92 | 2.3 | 2.1 | 3.3 | 9.0 | 55.3 (2020) |
| Georgia | 4.5 | 1.84 | 2.4 | 2.4 | 20.1 | 7.2 | 20.1 (2024) |
| Wisconsin | 4.4 | 0.99 | 4.5 | 1.5 | 4.9 | 3.8 | 6.4 (2019) |
| Vermont | 4.2 | 2.06 | 2.0 | 2.5 | 14.9 | 9.7 | 29.9 (2017) |
| New York | 4.1 | 1.41 | 2.9 | 2.4 | 8.0 | 5.1 | 8.0 (2024) |
| Tennessee | 3.8 | 1.55 | 2.4 | 2.4 | 4.8 | 6.6 | 15.4 (2023) |
| Wyoming | 3.7 | 1.51 | 2.5 | 1.9 | 2.3 | 3.0 | 4.9 (2020) |
| North Dakota | 3.5 | 1.19 | 3.0 | 1.3 | 1.7 | 3.2 | 11.3 (2022) |
| Texas | 3.5 | 1.76 | 2.0 | 2.5 | 26.9 | 9.0 | 26.9 (2024) |
| Ohio | 3.4 | 1.27 | 2.7 | 2.2 | 8.5 | 4.8 | 8.5 (2024) |
| Kansas | 3.2 | 1.31 | 2.5 | 1.6 | 4.8 | 4.1 | 6.1 (2017) |
| North Carolina | 3.2 | 1.36 | 2.3 | 2.4 | 25.3 | 10.1 | 31.3 (2018) |
| Connecticut | 3.1 | 0.94 | 3.3 | 1.3 | 2.5 | 8.5 | 50.6 (2020) |
| Iowa | 3.1 | 1.14 | 2.7 | 1.3 | 3.3 | 3.6 | 17.8 (2020) |
| Rhode Island | 3.0 | 0.96 | 3.2 | 1.0 | 1.7 | 5.4 | 12.1 (2017) |
| Minnesota | 3.0 | 1.18 | 2.6 | 1.6 | 3.7 | 2.9 | 5.1 (2016) |
| Maryland | 3.0 | 0.96 | 3.1 | 1.3 | 2.0 | 2.7 | 5.5 (2018) |
| New Mexico | 2.7 | 1.20 | 2.2 | 2.4 | 4.5 | 2.7 | 4.5 (2024) |
| New Jersey | 2.6 | 1.12 | 2.3 | 1.6 | 2.9 | 4.3 | 15.7 (2020) |
| South Carolina | 2.5 | 1.26 | 2.0 | 1.7 | 52.6 | 11.2 | 52.6 (2024) |
| New Hampshire | 2.5 | 1.12 | 2.2 | 1.4 | 12.3 | 6.7 | 15.3 (2017) |
| Illinois | 2.4 | 0.87 | 2.8 | 1.0 | 2.6 | 2.7 | 5.6 (2020) |
| Nevada | 2.1 | 1.12 | 1.9 | 1.7 | 2.6 | 2.0 | 3.3 (2022) |
| Massachusetts | 2.0 | 0.91 | 2.2 | 1.3 | 1.7 | 4.4 | 14.4 (2018) |
| Utah | 1.9 | 0.86 | 2.3 | 1.6 | 1.9 | 3.0 | 9.9 (2020) |
| Delaware | 1.7 | 0.94 | 1.8 | 1.2 | 2.0 | 2.2 | 4.5 (2020) |
| Florida | 1.2 | 0.84 | 1.4 | 1.1 | 24.8 | 10.0 | 44.9 (2017) |
| Arizona | 1.1 | 0.88 | 1.3 | 1.0 | 1.4 | 1.6 | 2.3 (2022) |
| Washington, D.C. | 0.8 | 0.32 | 2.6 | 0.6 | 0.5 | 1.1 | 1.9 (2016) |
Hours = SAIDI ÷ 60, all events including major event days. Outages = SAIFI, the sustained interruptions the average customer had. Hours per outage = SAIDI ÷ SAIFI.
Which states lost power the most over the past 11 years?
Averaged over 2015–2025, Louisiana customers lost power for 21.5 hours a year, more than any other state. Maine (17.9 hours) and West Virginia (14.2 hours) came next. A single year can mislead: West Virginia ranks near the top in 2025, while several hurricane states that led in 2024 fell back. The long-run average is a better guide to how often a household in each state should expect to lose power. The worst single state-year in the data is Louisiana in 2021, at 97.8 hours per customer.
How much outage time comes from major storms?
Major event days caused 53% of U.S. outage time in 2025 and 80% in 2024. A major event day is a day whose outage total exceeds a statistical threshold set from the utility's previous five years. It captures hurricanes, derechos, ice storms and wildfire shutoffs rather than routine equipment faults. Where outages ran longest in 2025, a typical interruption lasted 7.2 hours in Michigan, 6.8 hours in Nebraska and 5.7 hours in Missouri.
Are power outages getting worse?
Total outage time is up nationally, but the everyday baseline is not. U.S. customers averaged 5.4 hours a year without power in 2015–2019 and 7.0 hours in 2021–2025. Over the same periods, the figure excluding major events moved from 2.0 hours to 2.1 hours. By state, 12 averaged at least 50% more outage time in the later five years, led by Louisiana, Nebraska, Texas and Oregon, while 9 cut it by 20% or more.
How much battery does it take to ride out an outage?
A full-size fridge, a Wi-Fi router and two LED bulbs draw about 104 W on average. That is the 200 W fridge running about 33% of the time, a 20 W router and 9 W per bulb. Through a typical 85% efficient inverter, a full day of that load needs about 2,936 Wh of battery, and 15 of the 59 current power stations we track hold at least that much. Covering Louisiana's 2021 total on battery alone would take about 12 kWh. Long storm outages therefore call for solar recharging or a fuel generator kept outdoors.
Can you download and reuse this data?
Yes. The main table is available as a CSV file (52 rows), and every chart on this page opens as a full-size image when you select it. Our compilation, calculations and charts are licensed CC BY 4.0: reuse them in articles, reports, slides or lessons, as long as you credit RuntimeWise and link to this page. The underlying data belongs to the sources listed below, so please credit them too.
How should you cite this page?
Copy one of these. A link to this page is the only credit we ask for.
Citation
RuntimeWise (2026). Power Outage Statistics by State (2025 Data). Retrieved October 22, 2026, from https://www.runtimewise.com/data/power-outage-statistics/HTML link
<a href="https://www.runtimewise.com/data/power-outage-statistics/">Power Outage Statistics by State (2025 Data)</a> (RuntimeWise)How was this data compiled?
All outage figures come from the U.S. Energy Information Administration's Electric Power Annual, Tables 11.1, 11.4 and 11.5, which summarise the reliability section of Form EIA-861. We used the IEEE 1366 columns, downloaded on 2026-10-22. These figures cover utilities that report using the IEEE method, aggregated by EIA to state and national level.
- SAIDI is the total minutes of sustained interruptions the average customer had in a year; we divide by 60 to get hours. SAIFI is the number of sustained interruptions per customer. Momentary blinks are not counted.
- "Including major events" counts every outage. "Excluding major events" drops days above each utility's IEEE threshold (TMED), which isolates routine reliability.
- Our calculations: the 11-year average is the mean of the yearly values; the early and late periods are 2015–2019 and 2021–2025; hours per outage is SAIDI ÷ SAIFI.
- Limits: averages hide large differences between utilities and between towns in the same state. Utilities that don't use the IEEE method are left out, so coverage differs by state (EIA publishes the share of customers covered in Table 11.2). EIA revises figures when utilities resubmit.
- The battery section uses the appliance draws from our appliance wattage chart and the 85% inverter efficiency we use across the site. It is a calculation, not a test.