Power outage, battery and solar data
Our research pages collect the figures writers, students and researchers need about backup power: outage statistics, appliance wattages, sun hours, electricity prices, battery specs and prices, safety data and travel rules. Each page has a sortable table, a CSV download and full-size charts you can reuse under CC BY 4.0, with a link back.
Which dataset do you need?
What are the headline figures?
One figure from each dataset, with a link to the page that explains it.
The average U.S. electricity customer went without power for 4.5 hours in 2025, across 1.34 interruptions. That is down from 11.0 hours in 2024, the highest year in the 2015–2025 series. Power outage statistics by state
We list 53 appliances with their running watts and, for motor loads, their start-up (surge) watts. Each figure comes from a manufacturer spec sheet, ENERGY STAR data, the Department of Energy or a generator maker's wattage guide. Appliance wattage chart
Arizona gets the most sun: 6.52 peak sun hours a day on a panel tilted at latitude, averaged over 2001–2025. Alaska gets the least, 2.92. Peak sun hours by state
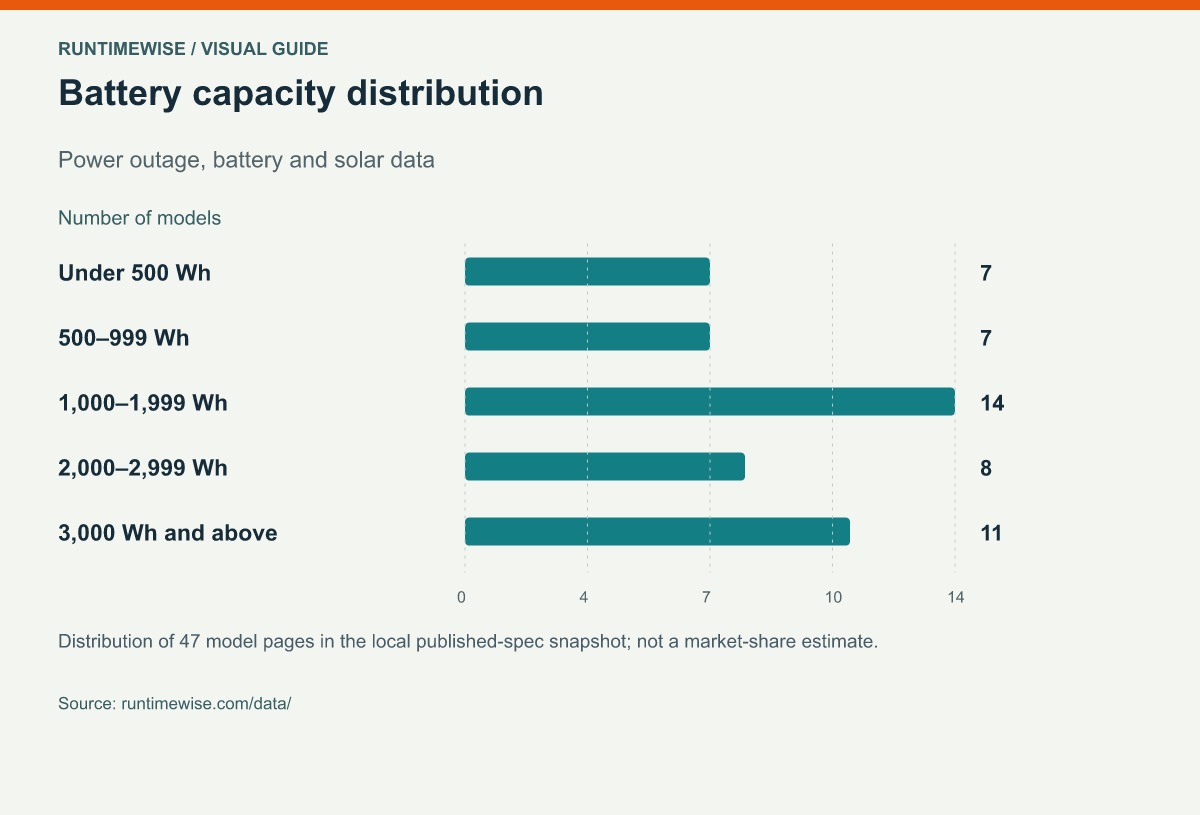
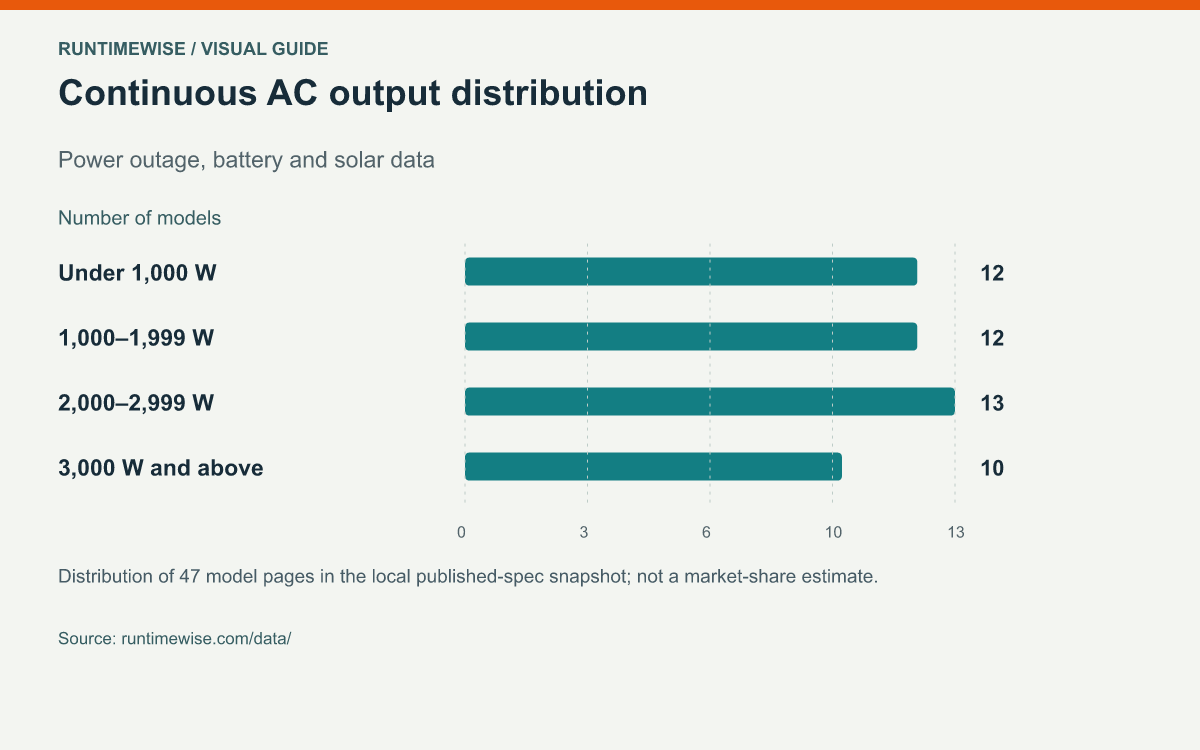
The database covers 59 current models from 6 brands. Every spec comes from the manufacturer's official U.S. product page or manual, with a source link and check date for each model. Portable power station database
At manufacturers' list prices, a watt-hour of portable power station capacity costs a median of $0.69 across 58 current models. Power station price per Wh
A full charge of a 1,000 Wh power station costs about $0.20 at the 2025 U.S. average residential electricity price of 17.23¢/kWh. Cost to charge a power station by state
3,352,867 Medicare beneficiaries rely on electricity-dependent medical equipment at home, such as ventilators, oxygen concentrators, home dialysis and powered wheelchairs. That is 4.8% of 70,162,721 beneficiaries (HHS emPOWER). Electricity-dependent medical devices by state
The U.S. Consumer Product Safety Commission has announced 5 recalls of portable power stations, covering about 87,270 units sold in the U.S. Portable power station recalls
Portable generators were linked to an estimated 892 carbon monoxide deaths from 2012 through 2022, 41% of all non-fire CO deaths from consumer products (CPSC). Generator carbon monoxide deaths
Under FAA rules, spare lithium batteries and power banks must go in carry-on bags. Up to 100 Wh is allowed, 101–160 Wh needs airline approval (two spares at most), and anything over 160 Wh is forbidden on passenger planes. Airline battery and power bank rules
Where does each dataset come from, and when is it updated?
Each dataset follows its source's release cycle. We re-run the downloads when a source publishes new figures, and the date at the top of each page shows when it was last rebuilt.
| Dataset | Main source | Coverage | Source updates |
|---|---|---|---|
| Power outage statistics by state | U.S. Energy Information Administration (Form EIA-861) | 50 states and D.C., 2015–2025 | Yearly, each autumn |
| Appliance wattage chart | Manufacturer spec sheets, ENERGY STAR, DOE, generator makers | 53 appliances | When a source changes |
| Peak sun hours by state | NASA POWER climatology | 50 states and D.C., monthly, 2001–2025 | Yearly |
| Portable power station database | Manufacturers' official U.S. pages and manuals | Every current model we track | Re-checked model by model |
| Power station price per Wh | Manufacturers' U.S. stores | Every current model with a list price | When list prices change |
| Cost to charge a power station by state | U.S. Energy Information Administration | 50 states and D.C., annual and latest month | Monthly and yearly |
| Electricity-dependent medical devices by state | HHS emPOWER program | 50 states and D.C. | Monthly |
| Portable power station recalls | U.S. Consumer Product Safety Commission | All U.S. power station recalls | When CPSC announces a recall |
| Generator carbon monoxide deaths | U.S. Consumer Product Safety Commission | United States, 2005–2022 | When CPSC publishes a new report |
| Airline battery and power bank rules | FAA, TSA, eCFR, ICAO, IATA and airlines' own pages | U.S. rules and major airlines | As airlines change policy |
Who is this data for?
Reporters covering storms, heat waves and grid failures can use the outage, medical-device and generator-safety figures for background. Writers and bloggers comparing backup power can use the appliance wattages, sun hours, electricity prices and battery prices. Students and researchers can download any table as a CSV. Travel writers can use the airline rules, which we check on each airline's own page. If you need a figure we don't have, ask us: we add datasets when official sources support them.
How do we build these pages?
We use official sources first: federal agencies (EIA, NASA, HHS, CPSC and FAA), manufacturers' own spec sheets and manuals, and airlines' own policy pages. Every table links to its source, every calculation is explained on its page, and each page shows when it was last updated. If you spot an error or a newer figure, tell us and we'll correct it.
Journalists and researchers don't need to ask before using our charts or data. A credit to RuntimeWise and a link to the page you used is all we ask.