Peak sun hours by state
On a panel tilted at latitude, peak sun hours in the U.S. range from 2.92 a day in Alaska to 6.52 in Arizona, based on NASA POWER data for 2001–2025. Below are every state's monthly figures, December's winter low and how many watt-hours a portable panel makes in each state.
Key findings
Arizona gets the most sun: 6.52 peak sun hours a day on a panel tilted at latitude, averaged over 2001–2025. Alaska gets the least, 2.92.
Across the 50 states and DC, a tilted panel averages 4.73 peak sun hours a day and a flat one 4.28.
Winter is the limit. December sun hours range from 5.04 in Hawaii to 0.52 in Alaska.
A 200 W portable panel makes about 978 Wh on an average day in Arizona and 438 Wh in Alaska, if it delivers 75% of its rating.
Refilling a 1,000 Wh power station from one 200 W panel takes about 1.3 December days in Hawaii but 12.8 in Alaska.
How many peak sun hours does each state get?
On a south-facing panel tilted at the local latitude, U.S. states get between 2.92 (Alaska) and 6.52 (Arizona) peak sun hours a day, according to NASA's POWER climatology for 2001–2025. A peak sun hour is one hour of sunlight at 1,000 W per square metre. The figure therefore equals the kWh of solar energy reaching each square metre of panel in a day.
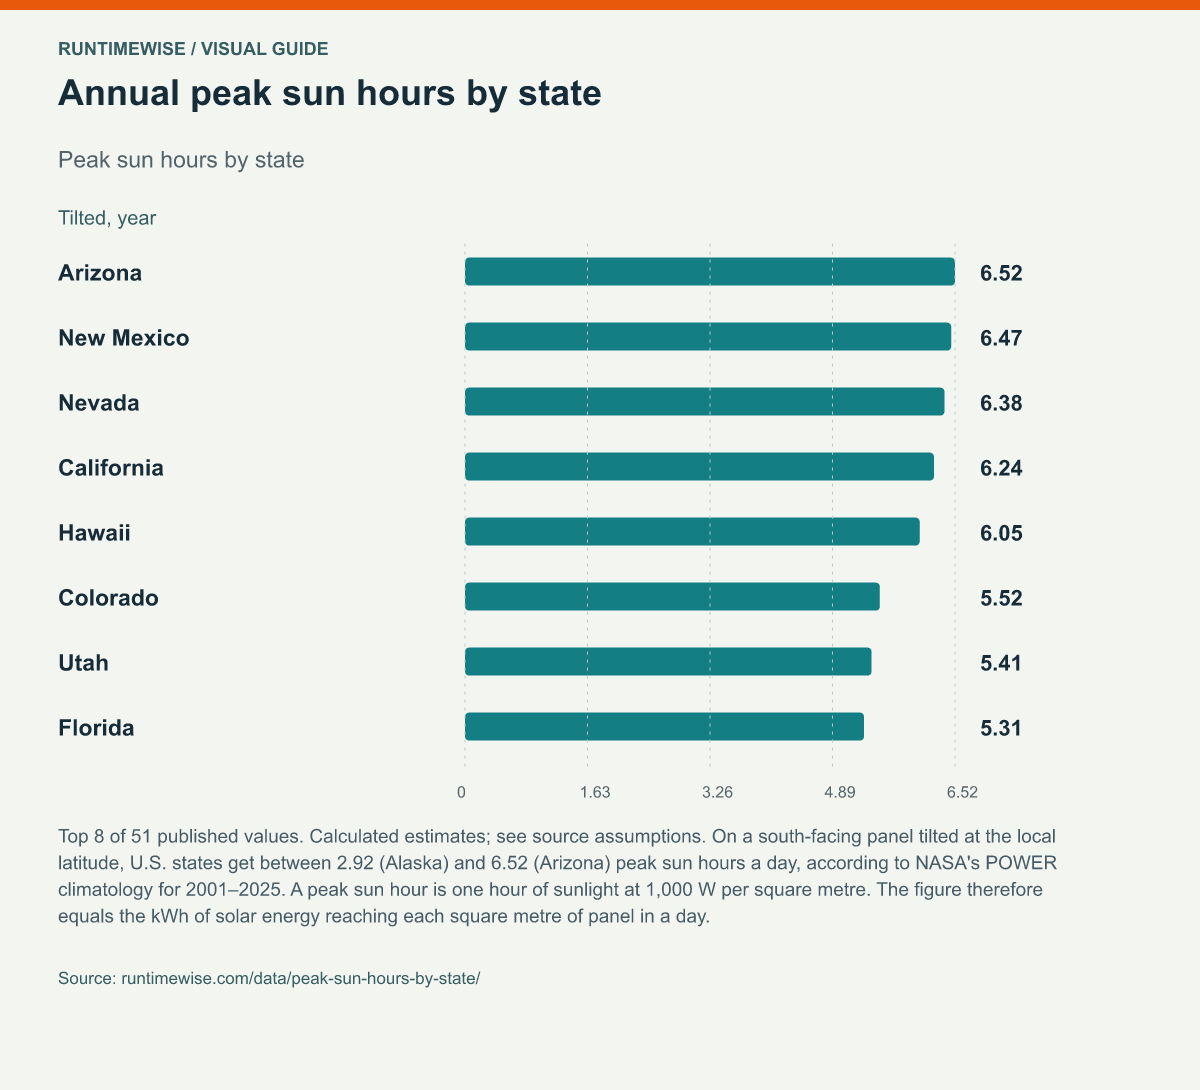
| State | Tilted, year | Flat, year | June | December | Lowest month | 100 W panel Wh a day | 200 W panel Wh a day | December days to fill 1 kWh (200 W) |
|---|---|---|---|---|---|---|---|---|
| Arizona | 6.52 | 5.80 | 7.44 | 4.90 | Dec (4.90) | 489 | 978 | 1.4 |
| New Mexico | 6.47 | 5.66 | 7.18 | 5.02 | Dec (5.02) | 485 | 970 | 1.3 |
| Nevada | 6.38 | 5.57 | 7.46 | 4.40 | Dec (4.40) | 479 | 957 | 1.5 |
| California | 6.24 | 5.58 | 7.46 | 4.06 | Dec (4.06) | 468 | 936 | 1.6 |
| Hawaii | 6.05 | 5.68 | 6.53 | 5.04 | Dec (5.04) | 453 | 907 | 1.3 |
| Colorado | 5.52 | 4.74 | 6.19 | 4.28 | Dec (4.28) | 414 | 828 | 1.6 |
| Utah | 5.41 | 4.80 | 6.83 | 3.23 | Dec (3.23) | 406 | 812 | 2.1 |
| Florida | 5.31 | 5.01 | 5.11 | 4.54 | Dec (4.54) | 398 | 796 | 1.5 |
| Wyoming | 5.26 | 4.59 | 6.65 | 3.17 | Dec (3.17) | 394 | 789 | 2.1 |
| Texas | 5.11 | 4.81 | 5.85 | 3.99 | Dec (3.99) | 383 | 766 | 1.7 |
| Oklahoma | 5.00 | 4.57 | 5.84 | 3.73 | Dec (3.73) | 375 | 750 | 1.8 |
| South Carolina | 4.96 | 4.56 | 5.59 | 3.81 | Dec (3.81) | 372 | 744 | 1.7 |
| Kansas | 4.95 | 4.44 | 5.89 | 3.61 | Dec (3.61) | 371 | 743 | 1.8 |
| Louisiana | 4.93 | 4.67 | 5.32 | 3.68 | Dec (3.68) | 369 | 739 | 1.8 |
| Georgia | 4.90 | 4.56 | 5.39 | 3.69 | Dec (3.69) | 368 | 736 | 1.8 |
| Nebraska | 4.89 | 4.30 | 5.88 | 3.31 | Dec (3.31) | 367 | 734 | 2.0 |
| Mississippi | 4.88 | 4.58 | 5.59 | 3.52 | Dec (3.52) | 366 | 732 | 1.9 |
| North Carolina | 4.86 | 4.44 | 5.53 | 3.65 | Dec (3.65) | 364 | 729 | 1.8 |
| South Dakota | 4.80 | 4.18 | 5.75 | 3.05 | Dec (3.05) | 360 | 721 | 2.2 |
| Alabama | 4.80 | 4.48 | 5.35 | 3.45 | Dec (3.45) | 360 | 720 | 1.9 |
| Idaho | 4.78 | 4.28 | 6.14 | 2.37 | Dec (2.37) | 359 | 718 | 2.8 |
| Arkansas | 4.75 | 4.38 | 5.63 | 3.52 | Dec (3.52) | 356 | 712 | 1.9 |
| Virginia | 4.68 | 4.27 | 5.54 | 3.40 | Dec (3.40) | 351 | 701 | 2.0 |
| Missouri | 4.67 | 4.24 | 5.70 | 3.20 | Dec (3.20) | 350 | 700 | 2.1 |
| Tennessee | 4.64 | 4.32 | 5.52 | 3.14 | Dec (3.14) | 348 | 696 | 2.1 |
| Montana | 4.64 | 4.05 | 5.73 | 2.46 | Dec (2.46) | 348 | 696 | 2.7 |
| North Dakota | 4.61 | 3.92 | 5.41 | 2.55 | Dec (2.55) | 345 | 691 | 2.6 |
| Iowa | 4.59 | 4.09 | 5.51 | 2.96 | Dec (2.96) | 344 | 689 | 2.3 |
| Washington, D.C. | 4.51 | 4.12 | 5.39 | 3.19 | Dec (3.19) | 338 | 677 | 2.1 |
| Delaware | 4.46 | 4.07 | 5.35 | 2.95 | Dec (2.95) | 335 | 670 | 2.3 |
| Kentucky | 4.45 | 4.15 | 5.48 | 2.82 | Dec (2.82) | 334 | 668 | 2.4 |
| Maryland | 4.43 | 4.04 | 5.37 | 2.92 | Dec (2.92) | 332 | 664 | 2.3 |
| Rhode Island | 4.40 | 3.99 | 5.26 | 2.60 | Dec (2.60) | 330 | 660 | 2.6 |
| Minnesota | 4.37 | 3.80 | 5.25 | 2.34 | Dec (2.34) | 327 | 655 | 2.8 |
| Oregon | 4.32 | 3.92 | 5.64 | 1.91 | Dec (1.91) | 324 | 649 | 3.5 |
| New Jersey | 4.32 | 3.92 | 5.15 | 2.75 | Dec (2.75) | 324 | 648 | 2.4 |
| Wisconsin | 4.32 | 3.85 | 5.28 | 2.40 | Dec (2.40) | 324 | 647 | 2.8 |
| Connecticut | 4.30 | 3.91 | 5.15 | 2.56 | Dec (2.56) | 323 | 646 | 2.6 |
| Massachusetts | 4.29 | 3.81 | 4.98 | 2.73 | Dec (2.73) | 322 | 644 | 2.4 |
| Indiana | 4.29 | 3.97 | 5.41 | 2.39 | Dec (2.39) | 322 | 643 | 2.8 |
| Illinois | 4.27 | 3.90 | 5.31 | 2.50 | Dec (2.50) | 320 | 640 | 2.7 |
| Maine | 4.24 | 3.70 | 4.89 | 2.48 | Dec (2.48) | 318 | 636 | 2.7 |
| Washington | 4.23 | 3.76 | 5.61 | 1.80 | Dec (1.80) | 317 | 635 | 3.7 |
| Pennsylvania | 4.22 | 3.86 | 5.17 | 2.51 | Dec (2.51) | 316 | 632 | 2.7 |
| West Virginia | 4.18 | 3.89 | 5.24 | 2.52 | Dec (2.52) | 313 | 626 | 2.6 |
| New Hampshire | 4.17 | 3.71 | 4.92 | 2.44 | Dec (2.44) | 313 | 625 | 2.7 |
| New York | 4.14 | 3.77 | 5.00 | 2.41 | Dec (2.41) | 311 | 622 | 2.8 |
| Michigan | 4.08 | 3.79 | 5.36 | 1.94 | Dec (1.94) | 306 | 612 | 3.4 |
| Ohio | 4.05 | 3.86 | 5.23 | 2.03 | Dec (2.03) | 304 | 607 | 3.3 |
| Vermont | 3.79 | 3.47 | 4.85 | 1.81 | Dec (1.81) | 284 | 568 | 3.7 |
| Alaska | 2.92 | 2.54 | 4.46 | 0.52 | Dec (0.52) | 219 | 438 | 12.8 |
Tilted = panel facing the equator at the latitude angle. Flat = panel lying horizontal. Panel output assumes 75% of the rated watts reaches the battery.
How do sun hours change month by month?
Northern states get two to four times as much sun in summer as in winter, while the Southwest stays strong all year. In New York, a tilted panel gets 5.0 peak sun hours a day in June and 2.4 in December. In Arizona the same months give 7.4 and 4.9. Tilting a panel helps most in winter, when the sun is low: across the states, a latitude-tilted panel gets 1.7 times the December sun of a flat one.
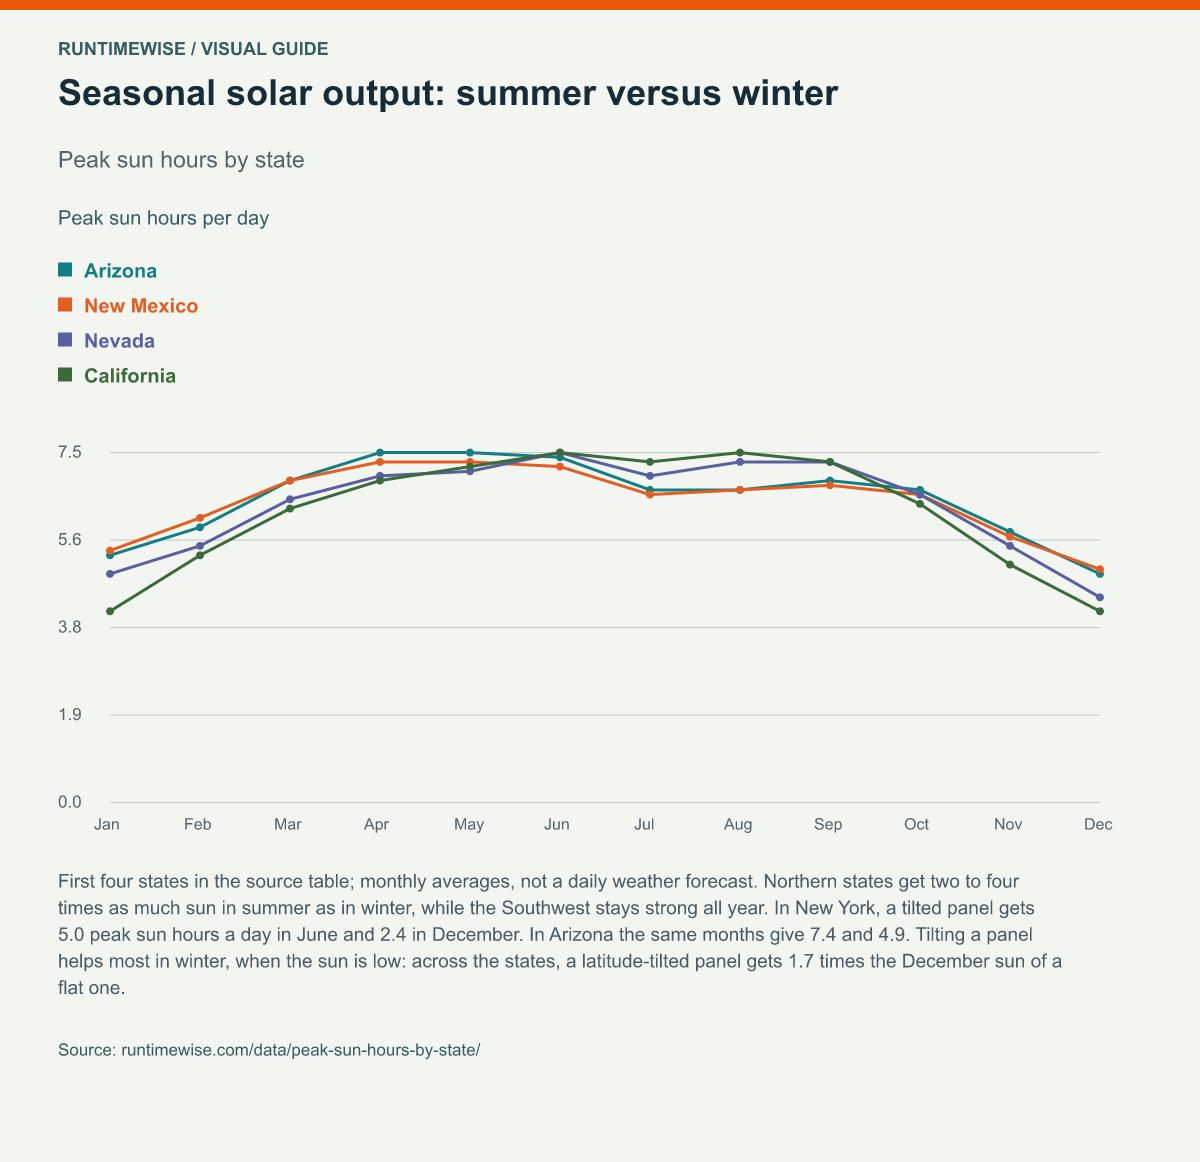
| State | Jan | Feb | Mar | Apr | May | Jun | Jul | Aug | Sep | Oct | Nov | Dec |
|---|---|---|---|---|---|---|---|---|---|---|---|---|
| Arizona | 5.3 | 5.9 | 6.9 | 7.5 | 7.5 | 7.4 | 6.7 | 6.7 | 6.9 | 6.7 | 5.8 | 4.9 |
| New Mexico | 5.4 | 6.1 | 6.9 | 7.3 | 7.3 | 7.2 | 6.6 | 6.7 | 6.8 | 6.6 | 5.7 | 5.0 |
| Nevada | 4.9 | 5.5 | 6.5 | 7.0 | 7.1 | 7.5 | 7.0 | 7.3 | 7.3 | 6.6 | 5.5 | 4.4 |
| California | 4.1 | 5.3 | 6.3 | 6.9 | 7.2 | 7.5 | 7.3 | 7.5 | 7.3 | 6.4 | 5.1 | 4.1 |
| Hawaii | 5.4 | 5.7 | 5.9 | 6.4 | 6.5 | 6.5 | 6.5 | 6.6 | 6.7 | 6.0 | 5.4 | 5.0 |
| Colorado | 4.6 | 5.5 | 6.0 | 5.9 | 5.7 | 6.2 | 5.8 | 5.7 | 6.1 | 5.6 | 4.8 | 4.3 |
| Utah | 3.7 | 4.4 | 5.4 | 5.7 | 6.1 | 6.8 | 6.8 | 6.6 | 6.5 | 5.5 | 4.1 | 3.2 |
| Florida | 4.9 | 5.3 | 5.9 | 6.1 | 5.9 | 5.1 | 5.1 | 5.2 | 5.2 | 5.4 | 5.0 | 4.5 |
| Wyoming | 3.7 | 4.3 | 5.1 | 5.5 | 5.9 | 6.6 | 6.7 | 6.5 | 6.3 | 5.1 | 4.1 | 3.2 |
| Texas | 4.3 | 4.4 | 4.9 | 5.3 | 5.2 | 5.8 | 6.0 | 6.1 | 5.5 | 5.3 | 4.4 | 4.0 |
| Oklahoma | 4.2 | 4.3 | 4.9 | 5.3 | 5.2 | 5.8 | 6.0 | 5.8 | 5.4 | 5.0 | 4.3 | 3.7 |
| South Carolina | 4.2 | 4.4 | 5.1 | 5.7 | 5.5 | 5.6 | 5.4 | 5.2 | 5.1 | 5.0 | 4.5 | 3.8 |
| Kansas | 3.9 | 4.4 | 4.9 | 5.3 | 5.4 | 5.9 | 5.9 | 5.7 | 5.4 | 4.9 | 4.2 | 3.6 |
| Louisiana | 4.0 | 4.1 | 5.0 | 5.6 | 5.6 | 5.3 | 5.2 | 5.3 | 5.4 | 5.4 | 4.7 | 3.7 |
| Georgia | 4.1 | 4.3 | 5.0 | 5.6 | 5.6 | 5.4 | 5.3 | 5.1 | 5.1 | 5.0 | 4.6 | 3.7 |
| Nebraska | 3.7 | 4.5 | 4.8 | 5.3 | 5.4 | 5.9 | 6.0 | 5.7 | 5.4 | 4.7 | 4.0 | 3.3 |
| Mississippi | 3.9 | 4.1 | 4.8 | 5.5 | 5.5 | 5.6 | 5.4 | 5.3 | 5.4 | 5.1 | 4.5 | 3.5 |
| North Carolina | 4.1 | 4.4 | 5.0 | 5.5 | 5.4 | 5.5 | 5.4 | 5.2 | 5.0 | 4.8 | 4.4 | 3.7 |
| South Dakota | 3.5 | 4.5 | 4.8 | 5.2 | 5.4 | 5.7 | 6.1 | 5.7 | 5.4 | 4.5 | 3.7 | 3.0 |
| Alabama | 3.9 | 4.1 | 4.8 | 5.5 | 5.5 | 5.4 | 5.2 | 5.1 | 5.2 | 5.0 | 4.4 | 3.4 |
| Idaho | 2.9 | 3.7 | 4.3 | 5.2 | 5.5 | 6.1 | 6.9 | 6.6 | 6.0 | 4.6 | 3.1 | 2.4 |
| Arkansas | 3.8 | 4.0 | 4.7 | 5.2 | 5.1 | 5.6 | 5.5 | 5.4 | 5.3 | 4.8 | 4.1 | 3.5 |
| Virginia | 3.7 | 4.2 | 4.7 | 5.2 | 5.3 | 5.5 | 5.4 | 5.2 | 4.8 | 4.5 | 4.1 | 3.4 |
| Missouri | 3.5 | 3.9 | 4.4 | 5.1 | 5.2 | 5.7 | 5.7 | 5.4 | 5.4 | 4.6 | 3.8 | 3.2 |
| Tennessee | 3.5 | 3.7 | 4.5 | 5.3 | 5.3 | 5.5 | 5.3 | 5.2 | 5.2 | 4.8 | 4.2 | 3.1 |
| Montana | 3.1 | 4.1 | 4.8 | 5.0 | 5.2 | 5.7 | 6.5 | 6.1 | 5.4 | 4.2 | 3.1 | 2.5 |
| North Dakota | 3.5 | 4.9 | 5.2 | 5.2 | 5.3 | 5.4 | 5.9 | 5.5 | 5.0 | 3.9 | 3.0 | 2.5 |
| Iowa | 3.3 | 4.3 | 4.6 | 5.0 | 5.2 | 5.5 | 5.7 | 5.4 | 5.3 | 4.3 | 3.6 | 3.0 |
| Washington, D.C. | 3.4 | 4.0 | 4.6 | 5.0 | 5.0 | 5.4 | 5.3 | 5.1 | 4.8 | 4.4 | 3.8 | 3.2 |
| Delaware | 3.2 | 4.0 | 4.5 | 5.0 | 5.0 | 5.3 | 5.4 | 5.2 | 4.9 | 4.2 | 3.7 | 2.9 |
| Kentucky | 3.1 | 3.5 | 4.3 | 5.1 | 5.1 | 5.5 | 5.3 | 5.3 | 5.1 | 4.5 | 3.8 | 2.8 |
| Maryland | 3.2 | 4.0 | 4.5 | 5.0 | 5.0 | 5.4 | 5.4 | 5.1 | 4.8 | 4.2 | 3.6 | 2.9 |
| Rhode Island | 3.0 | 3.9 | 4.6 | 5.1 | 5.1 | 5.3 | 5.5 | 5.4 | 5.1 | 4.0 | 3.2 | 2.6 |
| Minnesota | 3.2 | 4.6 | 4.9 | 4.9 | 5.0 | 5.2 | 5.6 | 5.2 | 4.7 | 3.8 | 2.9 | 2.3 |
| Oregon | 2.2 | 3.1 | 3.7 | 4.6 | 5.3 | 5.6 | 6.7 | 6.5 | 5.6 | 4.2 | 2.5 | 1.9 |
| New Jersey | 3.1 | 3.9 | 4.4 | 4.9 | 4.9 | 5.2 | 5.3 | 5.0 | 4.8 | 4.0 | 3.5 | 2.8 |
| Wisconsin | 3.0 | 4.2 | 4.7 | 4.7 | 5.0 | 5.3 | 5.5 | 5.2 | 4.9 | 3.8 | 3.0 | 2.4 |
| Connecticut | 3.0 | 3.8 | 4.4 | 5.0 | 5.0 | 5.2 | 5.3 | 5.2 | 5.0 | 3.9 | 3.3 | 2.6 |
| Massachusetts | 3.2 | 3.9 | 4.5 | 4.8 | 4.8 | 5.0 | 5.3 | 5.2 | 4.9 | 3.9 | 3.3 | 2.7 |
| Indiana | 2.7 | 3.6 | 4.2 | 4.8 | 5.0 | 5.4 | 5.5 | 5.4 | 5.1 | 4.1 | 3.2 | 2.4 |
| Illinois | 2.8 | 3.7 | 4.2 | 4.8 | 4.9 | 5.3 | 5.5 | 5.2 | 5.1 | 4.0 | 3.1 | 2.5 |
| Maine | 3.0 | 3.9 | 4.7 | 4.8 | 4.8 | 4.9 | 5.2 | 5.2 | 5.0 | 3.8 | 3.0 | 2.5 |
| Washington | 2.0 | 3.2 | 3.8 | 4.7 | 5.3 | 5.6 | 6.5 | 6.2 | 5.4 | 3.9 | 2.4 | 1.8 |
| Pennsylvania | 2.9 | 3.8 | 4.3 | 4.8 | 4.8 | 5.2 | 5.3 | 5.0 | 4.7 | 3.9 | 3.3 | 2.5 |
| West Virginia | 2.6 | 3.3 | 4.1 | 4.8 | 4.8 | 5.2 | 5.1 | 5.0 | 4.9 | 4.2 | 3.6 | 2.5 |
| New Hampshire | 2.9 | 3.7 | 4.4 | 4.8 | 4.8 | 4.9 | 5.2 | 5.2 | 5.0 | 3.7 | 3.1 | 2.4 |
| New York | 2.9 | 3.7 | 4.3 | 4.7 | 4.8 | 5.0 | 5.2 | 5.0 | 4.8 | 3.8 | 3.2 | 2.4 |
| Michigan | 2.3 | 3.4 | 4.3 | 4.7 | 4.9 | 5.4 | 5.6 | 5.2 | 4.9 | 3.7 | 2.8 | 1.9 |
| Ohio | 2.3 | 3.2 | 3.9 | 4.7 | 5.0 | 5.2 | 5.3 | 5.2 | 4.9 | 3.9 | 3.1 | 2.0 |
| Vermont | 2.3 | 3.1 | 4.0 | 4.4 | 4.7 | 4.8 | 5.0 | 5.0 | 4.7 | 3.3 | 2.4 | 1.8 |
| Alaska | 1.0 | 2.1 | 3.9 | 4.6 | 4.4 | 4.5 | 4.1 | 3.7 | 3.1 | 2.0 | 1.2 | 0.5 |
Which states are hardest for winter solar charging?
December is the weakest month almost everywhere, and northern and cloudy states fall furthest. Alaska (0.52), Washington (1.80), Vermont (1.81) and Oregon (1.91) get the fewest December peak sun hours. If you rely on solar to refill a power station during a winter outage, size the panels for December rather than for the annual average.
How much power does a portable solar panel make a day?
Daily energy ≈ panel watts × peak sun hours × real-world efficiency. Heat, angle, dust and controller losses mean portable panels rarely reach their rating, so we use 75%, the same default as our solar recharge calculator. At the national average of 4.73 peak sun hours, a 100 W panel makes about 355 Wh a day. A 200 W panel makes about 710 Wh and a 400 W array about 1,420 Wh. Those refill a 1,000 Wh power station in 2.8, 1.4 and 0.7 days.
Can you download and reuse this data?
Yes. The main table is available as a CSV file (51 rows), and every chart on this page opens as a full-size image when you select it. Our compilation, calculations and charts are licensed CC BY 4.0: reuse them in articles, reports, slides or lessons, as long as you credit RuntimeWise and link to this page. The underlying data belongs to the sources listed below, so please credit them too.
How should you cite this page?
Copy one of these. A link to this page is the only credit we ask for.
Citation
RuntimeWise (2026). Peak Sun Hours by State: Monthly Solar Data. Retrieved October 22, 2026, from https://www.runtimewise.com/data/peak-sun-hours-by-state/HTML link
<a href="https://www.runtimewise.com/data/peak-sun-hours-by-state/">Peak Sun Hours by State: Monthly Solar Data</a> (RuntimeWise)How was this data compiled?
Irradiance data comes from the Climatology API of NASA's Prediction Of Worldwide Energy Resources (POWER) project. It averages satellite-derived solar data over 25-year Meteorological and Solar Monthly & Annual Climatologies (January 2001 - December 2025). We queried one point per state: its 2020 center of population from the U.S. Census Bureau, so each figure reflects where most residents live rather than the state's geographic middle. We retrieved the data on 2026-10-22.
- Tilted is NASA's
SI_TILTED_AVG_LATITUDE, a surface facing the equator at the latitude angle. Flat isALLSKY_SFC_SW_DWN, a horizontal surface. Both are in kWh/m²/day, which equals peak sun hours. - Panel output is our calculation: watts × peak sun hours × 0.75. The 0.75 factor is an assumption covering heat, angle, wiring and controller losses. NREL's PVWatts assumes 14% system losses for fixed rooftop arrays, before inverter losses, and portable panels set up by hand usually do worse.
- Limits: NASA POWER data cells are about 1° × 1° (roughly 100 km), so mountains, coastlines and local fog are smoothed out. Large states such as Alaska vary widely between regions. Shade from trees or buildings isn't included.