How much does it cost to charge a power station in each state?
A full charge of a 1,000 Wh power station costs about $0.20 at the 2025 U.S. average residential electricity price. The cost ranges from $0.14 in North Dakota to $0.48 in Hawaii. Below are every state's costs for three common sizes, with EIA's latest monthly prices.
Key findings
A full charge of a 1,000 Wh power station costs about $0.20 at the 2025 U.S. average residential electricity price of 17.23¢/kWh.
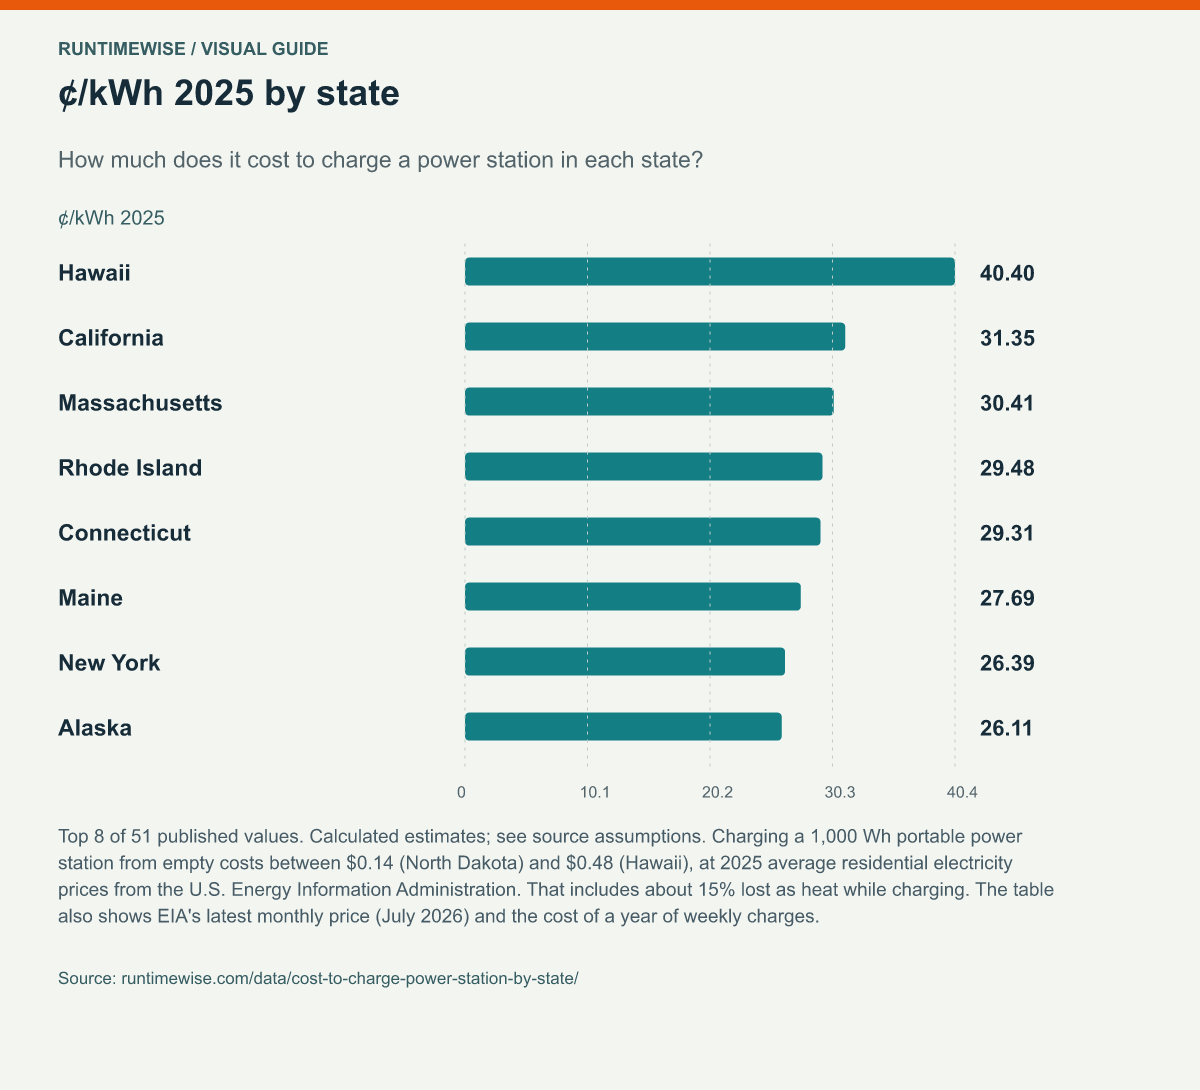
It costs most in Hawaii ($0.48 at 40.40¢/kWh) and least in North Dakota ($0.14 at 11.82¢/kWh).
Filling a large 3,600 Wh unit costs $0.73 at the U.S. average. Charging a 1,000 Wh unit once a week for a year costs $10.54.
Residential prices rose in 47 of 51 states between 2024 and 2025, and the U.S. average went from 16.48¢ to 17.23¢.
How much does it cost to charge a power station in each state?
Charging a 1,000 Wh portable power station from empty costs between $0.14 (North Dakota) and $0.48 (Hawaii), at 2025 average residential electricity prices from the U.S. Energy Information Administration. That includes about 15% lost as heat while charging. The table also shows EIA's latest monthly price (July 2026) and the cost of a year of weekly charges.
| State | ¢/kWh 2025 | ¢/kWh July 2026 | Full charge, 1,000 Wh | Full charge, 2,000 Wh | Full charge, 3,600 Wh | Weekly for a year, 1,000 Wh |
|---|---|---|---|---|---|---|
| Hawaii | 40.40 | 48.00 | $0.48 | $0.95 | $1.71 | $24.72 |
| California | 31.35 | 33.61 | $0.37 | $0.74 | $1.33 | $19.18 |
| Massachusetts | 30.41 | 30.49 | $0.36 | $0.72 | $1.29 | $18.60 |
| Rhode Island | 29.48 | 28.29 | $0.35 | $0.69 | $1.25 | $18.03 |
| Connecticut | 29.31 | 24.16 | $0.34 | $0.69 | $1.24 | $17.93 |
| Maine | 27.69 | 32.41 | $0.33 | $0.65 | $1.17 | $16.94 |
| New York | 26.39 | 29.90 | $0.31 | $0.62 | $1.12 | $16.14 |
| Alaska | 26.11 | 28.83 | $0.31 | $0.61 | $1.11 | $15.97 |
| New Hampshire | 24.53 | 26.60 | $0.29 | $0.58 | $1.04 | $15.01 |
| Vermont | 22.79 | 23.75 | $0.27 | $0.54 | $0.97 | $13.94 |
| New Jersey | 22.48 | 25.19 | $0.26 | $0.53 | $0.95 | $13.75 |
| Washington, D.C. | 21.92 | 25.21 | $0.26 | $0.52 | $0.93 | $13.41 |
| Michigan | 20.03 | 23.05 | $0.24 | $0.47 | $0.85 | $12.25 |
| Maryland | 19.53 | 21.41 | $0.23 | $0.46 | $0.83 | $11.95 |
| Pennsylvania | 19.29 | 21.72 | $0.23 | $0.45 | $0.82 | $11.80 |
| Wisconsin | 18.08 | 19.06 | $0.21 | $0.43 | $0.77 | $11.06 |
| Illinois | 17.67 | 19.22 | $0.21 | $0.42 | $0.75 | $10.81 |
| Delaware | 17.15 | 18.48 | $0.20 | $0.40 | $0.73 | $10.49 |
| Ohio | 16.90 | 19.45 | $0.20 | $0.40 | $0.72 | $10.34 |
| Alabama | 16.09 | 16.40 | $0.19 | $0.38 | $0.68 | $9.84 |
| Indiana | 15.96 | 16.73 | $0.19 | $0.38 | $0.68 | $9.76 |
| Minnesota | 15.83 | 17.45 | $0.19 | $0.37 | $0.67 | $9.68 |
| Colorado | 15.69 | 17.00 | $0.18 | $0.37 | $0.66 | $9.60 |
| Oregon | 15.46 | 15.97 | $0.18 | $0.36 | $0.65 | $9.46 |
| Texas | 15.40 | 15.88 | $0.18 | $0.36 | $0.65 | $9.42 |
| West Virginia | 15.39 | 15.78 | $0.18 | $0.36 | $0.65 | $9.42 |
| Virginia | 15.28 | 17.55 | $0.18 | $0.36 | $0.65 | $9.35 |
| Arizona | 15.26 | 15.38 | $0.18 | $0.36 | $0.65 | $9.34 |
| Florida | 15.21 | 15.03 | $0.18 | $0.36 | $0.64 | $9.30 |
| South Carolina | 15.12 | 15.47 | $0.18 | $0.36 | $0.64 | $9.25 |
| New Mexico | 14.85 | 16.09 | $0.17 | $0.35 | $0.63 | $9.08 |
| Georgia | 14.74 | 16.27 | $0.17 | $0.35 | $0.62 | $9.02 |
| Kansas | 14.44 | 15.27 | $0.17 | $0.34 | $0.61 | $8.83 |
| Mississippi | 14.03 | 14.54 | $0.17 | $0.33 | $0.59 | $8.58 |
| North Carolina | 14.00 | 15.16 | $0.16 | $0.33 | $0.59 | $8.56 |
| Iowa | 13.62 | 15.99 | $0.16 | $0.32 | $0.58 | $8.33 |
| Wyoming | 13.37 | 14.36 | $0.16 | $0.31 | $0.57 | $8.18 |
| South Dakota | 13.32 | 15.37 | $0.16 | $0.31 | $0.56 | $8.15 |
| Missouri | 13.30 | 16.09 | $0.16 | $0.31 | $0.56 | $8.14 |
| Nevada | 13.26 | 12.77 | $0.16 | $0.31 | $0.56 | $8.11 |
| Tennessee | 13.22 | 13.71 | $0.16 | $0.31 | $0.56 | $8.09 |
| Oklahoma | 13.21 | 14.35 | $0.16 | $0.31 | $0.56 | $8.08 |
| Washington | 13.17 | 14.71 | $0.15 | $0.31 | $0.56 | $8.06 |
| Kentucky | 13.13 | 13.81 | $0.15 | $0.31 | $0.56 | $8.03 |
| Utah | 13.02 | 13.12 | $0.15 | $0.31 | $0.55 | $7.97 |
| Montana | 12.99 | 14.99 | $0.15 | $0.31 | $0.55 | $7.95 |
| Arkansas | 12.87 | 14.33 | $0.15 | $0.30 | $0.55 | $7.87 |
| Louisiana | 12.52 | 12.72 | $0.15 | $0.29 | $0.53 | $7.66 |
| Nebraska | 12.05 | 13.78 | $0.14 | $0.28 | $0.51 | $7.37 |
| Idaho | 11.83 | 13.73 | $0.14 | $0.28 | $0.50 | $7.24 |
| North Dakota | 11.82 | 13.41 | $0.14 | $0.28 | $0.50 | $7.23 |
How do you work out the cost of charging a power station?
Cost = capacity in kWh ÷ charging efficiency × electricity price. A 2,000 Wh unit holds 2 kWh. Dividing by 0.85 gives about 2.35 kWh drawn from the wall, which costs $0.41 at 17.23¢/kWh. Check your own bill for your rate. Time-of-use plans can make overnight charging much cheaper, and many utilities charge more per kWh above a monthly threshold.
Which states have the highest electricity prices?
Hawaii has the highest average residential price, 40.40¢/kWh in 2025, followed by California (31.35¢), Massachusetts (30.41¢), Rhode Island (29.48¢) and Connecticut (29.31¢). The cheapest are North Dakota (11.82¢), Idaho (11.83¢) and Nebraska (12.05¢).
What does it cost to run outage essentials from a charged battery?
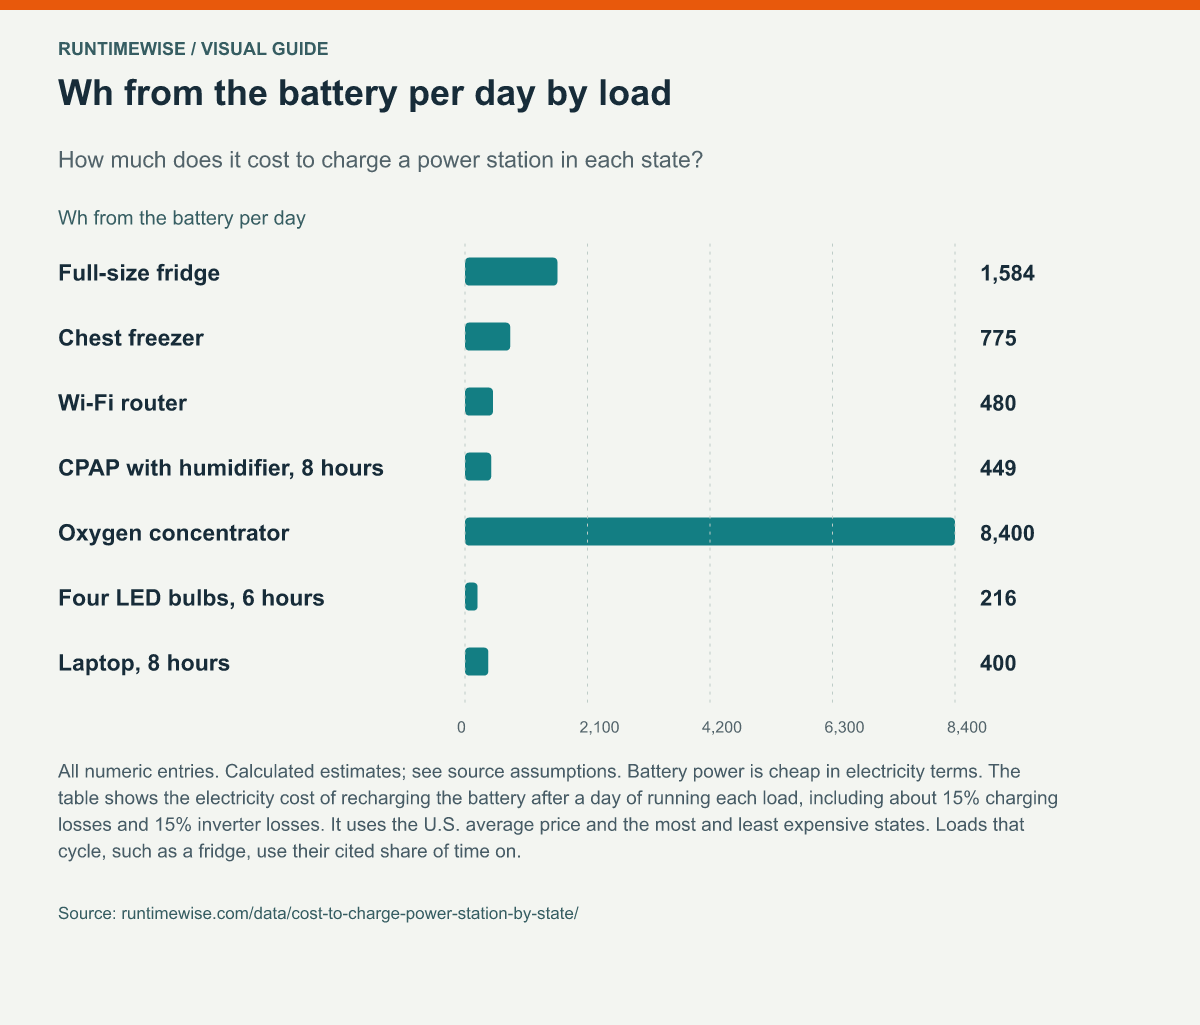
Battery power is cheap in electricity terms. The table shows the electricity cost of recharging the battery after a day of running each load, including about 15% charging losses and 15% inverter losses. It uses the U.S. average price and the most and least expensive states. Loads that cycle, such as a fridge, use their cited share of time on.
| Load | Wh from the battery per day | U.S. average (17.2¢) | Hawaii (40.4¢) | North Dakota (11.8¢) |
|---|---|---|---|---|
| Full-size fridge | 1,584 | $0.38 | $0.89 | $0.26 |
| Chest freezer | 775 | $0.18 | $0.43 | $0.13 |
| Wi-Fi router | 480 | $0.11 | $0.27 | $0.08 |
| CPAP with humidifier, 8 hours | 449 | $0.11 | $0.25 | $0.07 |
| Oxygen concentrator | 8,400 | $2.00 | $4.70 | $1.37 |
| Four LED bulbs, 6 hours | 216 | $0.05 | $0.12 | $0.04 |
| Laptop, 8 hours | 400 | $0.10 | $0.22 | $0.07 |
Daily Wh = running watts × share of time on × 24 hours, as listed in our appliance wattage chart; LED bulbs are counted for 6 hours a day.
Is it expensive to run appliances from a power station?
The electricity is cheap; the battery is the main cost. Running a full-size fridge for a day uses about 1.6 kWh at the appliance. After charging and inverter losses, that is about 2.2 kWh from the wall, or $0.38 at the U.S. average price. The battery's own cost per cycle is usually larger; see price per watt-hour. Solar charging removes the electricity cost, and peak sun hours by state shows what a panel makes where you live.
Can you download and reuse this data?
Yes. The main table is available as a CSV file (52 rows), and every chart on this page opens as a full-size image when you select it. Our compilation, calculations and charts are licensed CC BY 4.0: reuse them in articles, reports, slides or lessons, as long as you credit RuntimeWise and link to this page. The underlying data belongs to the sources listed below, so please credit them too.
How should you cite this page?
Copy one of these. A link to this page is the only credit we ask for.
Citation
RuntimeWise (2026). Cost to Charge a Portable Power Station by State. Retrieved October 22, 2026, from https://www.runtimewise.com/data/cost-to-charge-power-station-by-state/HTML link
<a href="https://www.runtimewise.com/data/cost-to-charge-power-station-by-state/">Cost to Charge a Portable Power Station by State</a> (RuntimeWise)How was this data compiled?
Prices are average residential retail prices in cents per kWh from the U.S. Energy Information Administration: Electric Power Annual Table 2.10 for 2025 and 2024, and Electric Power Monthly Table 5.6.A for July 2026. We downloaded both on 2026-10-22. Each average is total residential revenue divided by kWh sold, so it spreads fixed and delivery charges over usage.
- Charge cost = capacity ÷ 0.85 × price. The 0.85 factor is our assumption for losses in the charger and battery. Manufacturers rarely publish charging efficiency, and real losses vary by model and charging speed.
- "Weekly for a year" assumes 52 full charges of a 1,000 Wh unit.
- Limits: your rate depends on your utility, plan and time of use. Monthly prices swing with the seasons, so the main figures use the annual average.